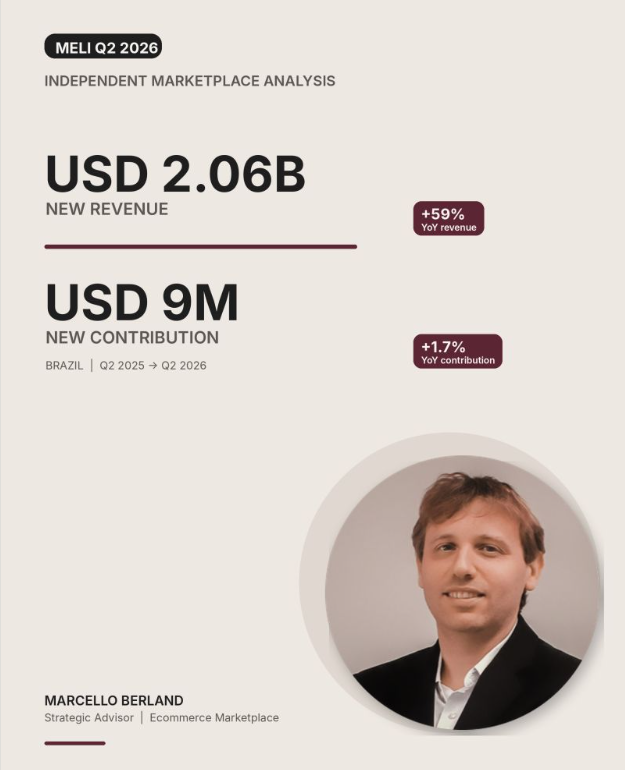
Q2 2026 revenue grew 49.8% to USD 10.17 billion. Direct Contribution grew 3.0%.
⠀
The growth engine remains exceptional. The economics supporting it are deteriorating, and Brazil makes that tension unusually visible.
⠀
Revenue rose from USD 3.47 billion to USD 5.53 billion. Direct Contribution rose from USD 541 million to USD 550 million.
⠀
USD 2.06 billion of new revenue produced USD 9 million of new contribution. Brazil’s contribution margin fell from 15.6% to 9.9%.
⠀
There was a sequential recovery from 8.1% in Q1. But the explanation matters. Mercado Libre says credit profitability and operating leverage “offset the impact of the pricing and supply initiatives.”
⠀
In other words, the pricing and supply initiatives were still a drag in Q2. Credit recovery and operating leverage absorbed their impact.
⠀
There is another signal worth watching.
⠀
Through Q1, Mercado Libre repeatedly highlighted falling unit shipping costs in Brazil as evidence that scale was repairing the economics of the BRL 19 free shipping decision. Unit shipping cost fell 11% YoY in Q4 2025, then 17% in Q1 2026.
⠀
In Q2, Mercado Libre did not update the metric. Higher shipping costs, however, reappeared as a source of margin compression.
⠀
The pattern is also broader than Brazil.
⠀
Mexico’s contribution margin fell from 17.4% to 13.1% in a single quarter, after five quarters around 18%. Argentina fell from 43.3% a year ago to 33.9%.
⠀
At group level:
⠀
Gross Margin: 45.6% → 40.9%
Direct Contribution Margin: 22.1% → 15.2%
Operating Margin: 12.2% → 6.7%
⠀
Revenue beat consensus. EPS beat consensus. The stock still closed 4.8% lower in the following session and has remained below its pre-results level.
⠀
Growth did not disappoint. The economics did.
⠀
Investors are no longer paying MELI simply for growth. They are increasingly pricing the economic capacity required to sustain it.
⠀
Growth must eventually finance growth.
⠀
Sea Limited reports Q2 tomorrow. I will follow with Shopee’s Q2 economics next week, then compare the two growth models directly.
⠀
What would you want measured in that comparison?
Sem categoria
Mercado Libre is consuming economic capacity faster than growth is replenishing it